Fuel economy in aircraft
.svg)
The fuel economy in aircraft is the measure of the transport energy efficiency of aircraft. Fuel efficiency is increased with better aerodynamics and by reducing weight, and with improved engine brake-specific fuel consumption and propulsive efficiency or thrust-specific fuel consumption. Endurance and range can be maximized with the optimum airspeed, and economy is better at optimum altitudes, usually higher. An airline efficiency depends on its fleet fuel burn, seating density, air cargo and passenger load factor, while operational procedures like maintenance and routing can save fuel.
Average fuel burn of new aircraft fell 45% from 1968 to 2014, a compounded annual reduction 1.3% with a variable reduction rate. In 2018, CO₂ emissions totalled 747 million tonnes for passenger transport, for 8.5 trillion revenue passenger kilometres (RPK), giving an average of 88 grams CO₂ per RPK;[2] this represents 28 g of fuel per kilometre, or a 3.5 L/100 km (67 mpg‑US) fuel consumption per passenger, on average. The worst-performing flights are short trips of from 500 to 1500 kilometres because the fuel used for takeoff is relatively large compared to the amount expended in the cruise segment, and because less fuel-efficient regional jets are typically used on shorter flights.[2]
New technology can reduce engine fuel consumption, like higher pressure and bypass ratios, geared turbofans, open rotors, hybrid electric or fully electric propulsion; and airframe efficiency with retrofits, better materials and systems and advanced aerodynamics.
Flight efficiency theory

A powered aircraft counters its weight through aerodynamic lift and counters its aerodynamic drag with thrust. The aircraft's maximum range is determined by the level of efficiency with which thrust can be applied to overcome the aerodynamic drag.
Aerodynamics
Design speed
By increasing efficiency, a lower cruise-speed augments the range and reduces the environmental impact of aviation. According to a research project completed in 2024 and focusing on short to medium range passenger aircraft, design for subsonic instead of transonic speed (about 15% less speed) with turboprop instead of turbofan propulsion would save 21% of fuel compared to an aircraft of conventional design speed and similar characteristics in terms of size, range and expected general technology improvements. Another analysis from 2014 compared the Airbus 320 from 2009 with a hypothetical turboprop successor flying at a 33% lower Mach number, concluding that the slower aircraft would have 36% less fuel consumption. Both state that the decrease of fuel costs enabled by lower design speed would overcompensate the increase of time-related costs resp. the decrease in revenue passenger miles flown per day. In other words, subsonic turboprop aircraft would be more profitable than transonic turbofan aircraft even at current energy prices without additional costs related to climate action like emission fees, aviation fuel taxation or higher prices for sustainable aviation fuels compared to fossile kerosene.[3][4][5]
For supersonic flight, drag increases at Mach 1.0 but decreases again after the transition. With a specifically designed aircraft, such as the (discontinued) Aerion AS2, the Mach 1.1 range at 3,700 nmi is 70% of the maximum range of 5,300 nmi at Mach 0.95, but increases to 4,750 nmi at Mach 1.4 for 90% before falling again.[6]
Wingtip devices
Wingtip devices increase the effective wing aspect ratio, lowering lift-induced drag caused by wingtip vortices and improving the lift-to-drag ratio without increasing the wingspan. (Wingspan is limited by the available width in the ICAO Aerodrome Reference Code.) Airbus installed wingtip fences on its planes since the A310-300 in 1985, and Sharklet blended-winglets for the A320 were launched during the November 2009 Dubai Airshow. They add 200 kilograms (440 lb) but offer a 3.5% fuel burn reduction on flights over 2,800 km (1,500 nmi).[7]
On average, among large commercial jets, Boeing 737-800s benefit the most from winglets. They average a 6.69% increase in efficiency but depending on the route have a fuel savings distribution spanning from 4.6% to 10.5%. Airbus A319s see the most consistent fuel and emissions savings from winglets. Airbus A321s average a 4.8% improvement in fuel consumption, but have the widest swing based on routes and individual aircraft, recognizing anywhere from 0.2% improvement to 10.75%.[8]
Weight

As the weight indirectly generates lift-induced drag, its minimization leads to better aircraft efficiency. For a given payload, a lighter airframe generates a lower drag. Minimizing weight can be achieved through the airframe's configuration, materials science and construction methods. To obtain a longer range, a larger fuel fraction of the maximum takeoff weight is needed, adversely affecting efficiency.[citation needed]
The deadweight of the airframe and fuel is non-payload that must be lifted to altitude and kept aloft, contributing to fuel consumption. A reduction in airframe weight enables the use of smaller, lighter engines. The weight savings in both allow for a lighter fuel load for a given range and payload. A rule-of-thumb is that a reduction in fuel consumption of about 0.75% results from each 1% reduction in weight.[9]
The payload fraction of modern twin-aisle aircraft is 18.4% to 20.8% of their maximum take-off weight, while single-aisle airliners are between 24.9% and 27.7%. An aircraft weight can be reduced with light-weight materials such as titanium, carbon fiber and other composite plastics if the expense can be recouped over the aircraft's lifetime. Fuel efficiency gains reduce the fuel carried, reducing the take-off weight for a positive feedback. For example, the Airbus A350 design includes a majority of light-weight composite materials. The Boeing 787 Dreamliner was the first airliner with a mostly composite airframe.[10]
Flight distance
For long-haul flights, the airplane needs to carry additional fuel, leading to higher fuel consumption. Above a certain distance it becomes more fuel-efficient to make a halfway stop to refuel, despite the energy losses in descent and climb. For example, a Boeing 777-300 reaches that point at 3,000 nautical miles (5,600 km). It is more fuel-efficient to make a non-stop flight at less than this distance and to make a stop when covering a greater total distance.[11]

Very long non-stop passenger flights suffer from the weight penalty of the extra fuel required, which means limiting the number of available seats to compensate. For such flights, the critical fiscal factor is the quantity of fuel burnt per seat-nautical mile.[12] For these reasons, the world's longest commercial flights were cancelled Template:Circa. An example is Singapore Airlines' former New York to Singapore flight, which could carry only 100 passengers (all business class) on the 10,300-mile (16,600 km) flight. According to an industry analyst, "It [was] pretty much a fuel tanker in the air."[13] Singapore Airlines Flights 21 and 22 were re-launched in 2018 with more seats in an A350-900ULR.
In the late 2000s/early 2010s, rising fuel prices coupled with the Great Recession caused the cancellation of many ultra-long haul, non-stop flights. This included the services provided by Singapore Airlines from Singapore to both Newark and Los Angeles that was ended in late 2013.[14][15] But as fuel prices have since decreased and more fuel-efficient aircraft have come into service, many ultra-long-haul routes have been reinstated or newly scheduled[16] (see Longest flights).
Propulsive efficiency

The efficiency can be defined as the amount of energy imparted to the plane per unit of energy in the fuel. The rate at which energy is imparted equals thrust multiplied by airspeed.[citation needed]
To get thrust, an aircraft engine is either a shaft engine – piston engine or turboprop, with its efficiency inversely proportional to its brake-specific fuel consumption – coupled with a propeller having its own propulsive efficiency; or a jet engine with its efficiency given by its airspeed divided by the thrust-specific fuel consumption and the specific energy of the fuel.[17]Template:Request quotation
Turboprops have an optimum speed below 460 miles per hour (740 km/h).[18] This is less than jets used by major airlines today, however propeller planes are much more efficient.[19]Template:Request quotation The Bombardier Dash 8 Q400 turboprop is used for this reason as a regional airliner.[20][21]Template:Vn
Jet fuel cost and emissions reduction have renewed interest in the propfan concept for jetliners with an emphasis on engine/airframe efficiency that might come into service beyond the Boeing 787 and Airbus A350XWB. For instance, Airbus has patented aircraft designs with twin rear-mounted counter-rotating propfans.[22] Propfans bridge the gap between turboprops, losing efficiency beyond Mach 0.5-0.6, and high-bypass turbofans, more efficient beyond Mach 0.8. NASA has conducted an Advanced Turboprop Project (ATP), where they researched a variable-pitch propfan that produced less noise and achieved high speeds.[23]
Operations
.jpg)
In Europe in 2017, the average airline fuel consumption per passenger was 3.4 L/100 km (69 mpg‑US), 24% less than in 2005, but as the traffic grew by 60% to 1,643 billion passenger kilometres, CO₂ emissions were up by 16% to 163 million tonnes for 99.8 g/km CO₂ per passenger.[24] In 2018, the US airlines had a fuel consumption of 58 mpg‑US (4.06 L/100 km) per revenue passenger for domestic flights,[25] or 32.5 g of fuel per km, generating 102 g CO₂ / RPK of emissions.
Seating classes
In 2013, the World Bank evaluated the business class carbon footprint as 3.04 times higher than economy class in wide-body aircraft, and first class 9.28 times higher, due to premium seating taking more space, lower weight factors, and larger baggage allowances (assuming Load Factors of 80% for Economy Class, 60% for Business Class, and 40% for First Class).[26]
Speed
At constant propulsive efficiency, the maximum range speed is when the ratio between velocity and drag is minimal,[27] while maximum endurance is attained at the best lift-to-drag ratio.
Altitude
Air density decreases with altitude, thus lowering drag, assuming the aircraft maintains a constant equivalent airspeed. However, air pressure and temperature both decrease with altitude, causing the maximum power or thrust of aircraft engines to reduce. To minimize fuel consumption, an aircraft should cruise close to the maximum altitude at which it can generate sufficient lift to maintain its altitude. As the aircraft's weight decreases throughout the flight, due to fuel burn, its optimum cruising altitude increases.
In a piston engine, the decrease in pressure at higher altitudes can be mitigated by the installation of a turbocharger.
Decreasing temperature at higher altitudes increases thermal efficiency.[citation needed]
Airlines
.jpg)
Since early 2006 until 2008, Scandinavian Airlines was flying slower, from 860 to 780 km/h, to save on fuel costs and curb emissions of carbon dioxide.[28]
From 2010 to 2012, the most fuel-efficient US domestic airline was Alaska Airlines, due partly to its regional affiliate Horizon Air flying turboprops.[20] In 2014, MSCI ranked Ryanair as the lowest-emissions-intensity airline in its ACWI index with 75 g CO2-e/revenue passenger kilometre – below Easyjet at 82 g, the average at 123 g and Lufthansa at 132 g – by using high-density 189-seat Boeing 737-800s. In 2015 Ryanair emitted 8.64 Bn t of CO2 for 545,034 sectors flown: 15.85 t per 776 miles (674 nmi; 1,249 km) average sector (or 5.04 t of fuel: 4.04 kg/km) representing 95 kg per 90.6 million passengers (30.4 kg of fuel: 3.04 L/100 km or 76 g CO2/km).[29]
In 2016, over the transpacific routes, the average fuel consumption was 31 pax-km per L (3.23 L/100 km [73 mpg‑US] per passenger). The most fuel-efficient were Hainan Airlines and ANA with 36 pax-km/L (2.78 L/100 km [85 mpg‑US] per passenger) while Qantas was the least efficient at 22 pax-km/L (4.55 L/100 km [51.7 mpg‑US] per passenger).[30] Key drivers for efficiency were the air freight share for 48%, seating density for 24%, aircraft fuel burn for 16% and passenger load factor for 12%.[30] That same year, Cathay Pacific and Cathay Dragon consumed 4,571,000 tonnes of fuel to transport 123,478 million revenue passenger kilometers, or 37 g/RPK, 25% better than in 1998: 4.63 L/100 km (50.8 mpg‑US).[31] Again in 2016, the Aeroflot Group fuel consumption is 22.9g/ASK, or 2.86 L/100 km (82 mpg‑US) per seat, 3.51 L/100 km (67.0 mpg‑US) per passenger at its 81.5% load factor.[32]
Fuel economy in air transport comes from the fuel efficiency of the aircraft + engine model, combined with airline efficiency: seating configuration, passenger load factor and air cargo. Over the transatlantic route, the most-active intercontinental market, the average fuel consumption in 2017 was 34 pax-km per L (2.94 L/100 km [80 mpg‑US] per passenger). The most fuel-efficient airline was Norwegian Air Shuttle with 44 pax-km/L (2.27 L/100 km [104 mpg‑US] per passenger), thanks to its fuel-efficient Boeing 787-8, a high 85% passenger load factor and a high density of 1.36 seat/m2 due to a low 9% premium seating. On the other side, the least efficient was British Airways at 27 pax-km/L (3.7 L/100 km [64 mpg‑US] per passenger), using fuel-inefficient Boeing 747-400s with a low density of 0.75 seat/m2 due to a high 25% premium seating, in spite of a high 82% load factor.[33]
In 2018, CO₂ emissions totalled 918 Mt with passenger transport accounting for 81% or 744 Mt, for 8.2 trillion revenue passenger kilometres:[34] an average fuel economy of 90.7 g/RPK CO₂ - 29 g/km of fuel (3.61 L/100 km [65.2 mpg‑US] per passenger)
In 2019, Wizz Air stated a 57 g/RPK CO₂ emissions (equivalent to 18.1 g/km of fuel, 2.27 L/100 km [104 mpg‑US] per passenger), 40% lower than IAG or Lufthansa (95 g CO₂/RPK - 30 g/km of fuel, 3.8 L/100 km [62 mpg‑US] per passenger), due to their business classes, lower-density seating, and flight connections.[35]
In 2021, the highest seating density in its A330neo, with 459 single-class seats, enabled Cebu Pacific to claim the lowest carbon footprint with 1.4 kg (3 lb) of fuel per seat per 100 km,[36] equivalent to 1.75 L/100 km [134 mpg‑US] per seat.
Procedures
.jpg)
Continuous Descent Approaches can reduce emissions.[37] Beyond single-engine taxi, electric taxiing could allow taxiing on APU power alone, with the main engines shut down, to lower the fuel burn.[38][39]
Airbus presented the following measures to save fuel, in its example of an Airbus A330 flying 2,500 nautical miles (4,600 km) on a route like Bangkok–Tokyo: direct routing saves 190 kg (420 lb) fuel by flying 40 km (25 mi) less; 600 kg (1,300 lb) more fuel is consumed if flying 600 m (2,000 ft) below optimum altitude without vertical flight profile optimization; cruising Mach 0.01 above the optimum speed consumes 800 kg (1,800 lb) more fuel; 1,000 kg (2,200 lb) more fuel on board consumes 150 kg (330 lb) more fuel while 100 litres (22 imp gal; 26 US gal) of unused potable water consumes 15 kg (33 lb) more fuel.[40]
Operational procedures can save 35 kg (77 lb) fuel for every 10-minute reduction in use of the Auxiliary power unit (APU), 15 kg (33 lb) with a reduced flap approach and 30 kg (66 lb) with reduced thrust reversal on landing.[40] Maintenance can also save fuel: 100 kg (220 lb) more fuel is consumed without an engine wash schedule; 50 kg (110 lb) with a 5 mm (0.20 in) slat rigging gap, 40 kg (88 lb) with a 10 mm (0.39 in) spoiler rigging gap, and 15 kg (33 lb) with a damaged door seal.[40]
Yield management allows the optimization of the load factor, benefiting the fuel efficiency, as is the air traffic management optimization.[41]
By taking advantage of wake updraft like migrating birds (biomimicry), Airbus believes an aircraft can save 5-10% of fuel by flying in formation, 1.5–2 nmi (2.8–3.7 km) behind the preceding one.[42] After Airbus A380 tests showing 12% savings, test flights were scheduled for 2020 with two Airbus A350s, before transatlantic flight trials with airlines in 2021.[42] Certification for shorter separation is enabled by ADS-B in oceanic airspace, and the only modification required would be flight control systems software.[42] Comfort would not be affected and trials are limited to two aircraft to reduce complexity but the concept could be expanded to include more.[42] Commercial operations could begin in 2025 with airline schedule adjustments, and other manufacturers' aircraft could be included.[42]
While routes are up to 10% longer than necessary, modernized air traffic control systems using ADS-B technology like the FAA NextGen or European SESAR could allow more direct routing, but there is resistance from air traffic controllers.[43]
History
Past

Modern jet aircraft have twice the fuel efficiency of the earliest jet airliners.[44] Late 1950s piston airliners like the Lockheed L-1049 Super Constellation and DC-7 were 1% to 28% more energy-intensive than 1990s jet airliners which cruise 40 to 80% faster.[45] The early jet airliners were designed at a time when air crew labor costs were higher relative to fuel costs. Despite the high fuel consumption, because fuel was inexpensive in that era the higher speed resulted in favorable economical returns since crew costs and amortization of capital investment in the aircraft could be spread over more seat-miles flown per day.[46] Productivity including speed went from around 150 ASK/MJ*km/h for the 1930s DC-3 to 550 for the L-1049 in the 1950s, and from 200 for the DH-106 Comet 3 to 900 for the 1990s B737-800.[47]
Today's turboprop airliners have better fuel-efficiency than current jet airliners, in part because of their propellers. In 2012, turboprop airliner usage was correlated with US regional carriers' fuel efficiency.[20]
.jpg)
Jet airliners became 70% more fuel efficient between 1967 and 2007,[49] 40% due to improvements in engine efficiency and 30% from airframes.[50] Efficiency gains were larger early in the jet age than later, with a 55-67% gain from 1960 to 1980 and a 20-26% gain from 1980 to 2000.[45] Average fuel burn of new aircraft fell 45% from 1968 to 2014, a compounded annual reduction 1.3% with variable reduction rate.[51]
Concorde, a supersonic transport, managed about 17 passenger-miles to the Imperial gallon, which is 16.7 L/100 km per passenger; similar to a business jet, but much worse than a subsonic turbofan aircraft. Airbus states a fuel rate consumption of their A380 at less than 3 L/100 km per passenger (78 passenger-miles per US gallon).[52]
Newer aircraft like the Boeing 787 Dreamliner, Airbus A350 and Bombardier CSeries, are 20% more fuel efficient per passenger kilometre than previous generation aircraft. For the 787, this is achieved through more fuel-efficient engines and lighter composite material airframes, and also through more aerodynamic shapes, winglets, more advanced computer systems for optimising routes and aircraft loading.[53]Template:Verify-inline A life-cycle assessment based on the Boeing 787 shows a 20% emission savings compared to conventional aluminium airliners, 14-15% fleet-wide when encompassing a fleet penetration below 100%, while the air travel demand would increase due to lower operating costs.[54]
Lufthansa, when it ordered both, stated the Airbus A350-900 and the Boeing 777X-9 will consume an average of 2.9 L/100 km (81 mpg‑US) per passenger.[55] The Airbus A321 featuring Sharklet wingtip devices consumes 2.2 L/100 km (110 mpg‑US) per person with a 200-seat layout for WOW Air.[56]
Airbus airliners delivered in 2019 had a carbon intensity of 66.6 g of CO2e per passenger-kilometre, improving to 63.5g in 2020.[57]
Example values
The aviation fuel density used is 6.7 lb/USgal or 0.8 kg/L.
Commuter flights
For flights of 300 nmi (560 km):
| Model | First flight | Seats | Fuel burn | Fuel per seat |
|---|---|---|---|---|
| Antonov An-148 (241 nmi) | 2004 | 89 | 4.23 kg/km (15.0 lb/mi) | 5.95 L/100 km (39.5 mpg‑US)[58] |
| Antonov An-158 (241 nmi) | 2010 | 99 | 4.34 kg/km (15.4 lb/mi) | 5.47 L/100 km (43.0 mpg‑US)[58] |
| ATR 42-500 | 1995 | 48 | 1.26 kg/km (4.5 lb/mi) | 3.15 L/100 km (75 mpg‑US)[59] |
| ATR 72-500 | 1997 | 72 | 1.67 kg/km (5.9 lb/mi) | 2.89 L/100 km (81 mpg‑US)[59] |
| ATR 72-500 | 1997 | 70 | 1.42 kg/km (5.0 lb/mi) | 2.53 L/100 km (93 mpg‑US)[60] |
| ATR 72-600 | 2010 | 72 | 1.56 kg/km (5.5 lb/mi) | 2.79 L/100 km (84 mpg‑US)[61] |
| Beechcraft 1900D (226 nm) | 1982 | 19 | 1.00 kg/km (3.56 lb/mi) | 6.57 L/100 km (35.8 mpg‑US)[62] |
| Bombardier CRJ100 | 1991 | 50 | 2.21 kg/km (7.83 lb/mi) | 5.50 L/100 km (42.8 mpg‑US)[63] |
| Bombardier CRJ200 | 1995 | 50 | 2.18 kg/km (7.73 lb/mi) | 5.43 L/100 km (43.3 mpg‑US)[63] |
| Bombardier CRJ700 | 1999 | 70 | 2.95 kg/km (10.47 lb/mi) | 5.25 L/100 km (44.8 mpg‑US)[63] |
| Bombardier CRJ900 | 2001 | 88 | 3.47 kg/km (12.31 lb/mi) | 4.91 L/100 km (47.9 mpg‑US)[63] |
| Bombardier Dash 8 Q400 | 1998 | 78 | 2.16 kg/km (7.7 lb/mi) | 3.46 L/100 km (68.0 mpg‑US)[64] |
| Dornier 228 | 1981 | 19 | 0.94 kg/km (3.3 lb/mi) | 6.22 L/100 km (37.8 mpg‑US)[65] |
| Dornier 328 | 1991 | 32 | 1.22 kg/km (4.3 lb/mi) | 4.76 L/100 km (49.4 mpg‑US)[66] |
| Embraer Brasilia | 1983 | 30 | 0.92 kg/km (3.3 lb/mi) | 3.82 L/100 km (61.6 mpg‑US)[67] |
| Embraer ERJ-135ER (309 nmi) | 1998 | 37 | 1.64 kg/km (5.83 lb/mi) | 5.52 L/100 km (42.6 mpg‑US)[68] |
| Embraer ERJ-145ER (305 nmi) | 1995 | 50 | 1.76 kg/km (6.23 lb/mi) | 4.37 L/100 km (53.8 mpg‑US)[68] |
| Saab 340 | 1983 | 32 | 1.1 kg/km (3.9 lb/mi) | 4.29 L/100 km (54.8 mpg‑US)[69]
|
| Saab 2000 | 1992 | 50 | 1.75 kg/km (6.2 lb/mi) | 4.39 L/100 km (53.6 mpg‑US)[70] |
Regional flights
For flights of 500–700 nmi (930–1,300 km)
| Model | First flight | Seats | Sector | Fuel burn | Fuel efficiency per seat |
|---|---|---|---|---|---|
| Airbus A220 100 | 2013 | 115 | 600 nmi (1,100 km) | 2.8 kg/km (10.1 lb/mi) | 3.07 L/100 km (76.7 mpg‑US)[71] |
| Airbus A220 300 | 2015 | 140 | 600 nmi (1,100 km) | 3.10 kg/km (11.01 lb/mi) | 2.75 L/100 km (85.6 mpg‑US)[71] |
| Airbus A220-100 | 2013 | 125 | 500 nmi (930 km) | 2.57 kg/km (9.1 lb/mi) | 2.57 L/100 km (92 mpg‑US)[72] |
| Airbus A220-300 | 2015 | 160 | 500 nmi (930 km) | 2.85 kg/km (10.11 lb/mi) | 2.23 L/100 km (105 mpg‑US)[73] |
| Airbus A319neo | 2015 | 144 | 600 nmi (1,100 km) | 3.37 kg/km (11.94 lb/mi) | 2.92 L/100 km (80.6 mpg‑US)[71] |
| Airbus A319neo | 2015 | 124 | 660 nmi (1,220 km) | 2.82 kg/km (10 lb/mi) | 2.82 L/100 km (83.5 mpg‑US)[74] |
| Airbus A320neo | 2015 | 154 | 660 nmi (1,220 km) | 2.79 kg/km (9.9 lb/mi) | 2.25 L/100 km (104.7 mpg‑US)[74] |
| Airbus A321neo | 2015 | 192 | 660 nmi (1,220 km) | 3.30 kg/km (11.7 lb/mi) | 2.19 L/100 km (107.4 mpg‑US)[74] |
| Antonov An-148 | 2004 | 89 | 684 nmi (1,267 km) | 2.89 kg/km (10.3 lb/mi) | 4.06 L/100 km (57.9 mpg‑US)[58] |
| Antonov An-158 | 2010 | 99 | 684 nmi (1,267 km) | 3 kg/km (11 lb/mi) | 3.79 L/100 km (62.1 mpg‑US)[58] |
| ATR 42-600 | 2010 | 50 | 500 nmi (930 km) | 1.30 kg/km (4.6 lb/mi) | 3.27 L/100 km (72 mpg‑US)[75] |
| ATR 72-600 | 2010 | 72 | 500 nmi (930 km) | 1.41 kg/km (5 lb/mi) | 2.46 L/100 km (96 mpg‑US)[76] |
| Boeing 737-300 | 1984 | 126 | 507 nmi (939 km) | 3.49 kg/km (12.4 lb/mi) | 3.46 L/100 km (68 mpg‑US)[77] |
| Boeing 737-600 | 1998 | 110 | 500 nmi (930 km) | 3.16 kg/km (11.2 lb/mi) | 3.59 L/100 km (65.5 mpg‑US)[78] |
| Boeing 737-700 | 1997 | 126 | 500 nmi (930 km) | 3.21 kg/km (11.4 lb/mi) | 3.19 L/100 km (74 mpg‑US)[78] |
| Boeing 737 MAX 7 | 2017 | 128 | 660 nmi (1,220 km) | 2.85 kg/km (10.1 lb/mi) | 2.77 L/100 km (84.8 mpg‑US)[74] |
| Boeing 737 MAX 7 | 2017 | 144 | 600 nmi (1,100 km) | 3.39 kg/km (12.01 lb/mi) | 2.93 L/100 km (80.2 mpg‑US)[71] |
| Boeing 737-800 | 1997 | 162 | 500 nmi (930 km) | 3.59 kg/km (12.7 lb/mi) | 2.77 L/100 km (85 mpg‑US)[78] |
| Boeing 737 MAX 8 | 2017 | 166 | 660 nmi (1,220 km) | 3.04 kg/km (10.8 lb/mi) | 2.28 L/100 km (103.2 mpg‑US)[74] |
| Boeing 737-900ER | 2006 | 180 | 500 nmi (930 km) | 3.83 kg/km (13.6 lb/mi) | 2.66 L/100 km (88 mpg‑US)[78] |
| Boeing 737 MAX 9 | 2017 | 180 | 660 nmi (1,220 km) | 3.30 kg/km (11.7 lb/mi) | 2.28 L/100 km (103 mpg‑US)[74] |
| Boeing 757-200 | 1982 | 200 | 500 nmi (930 km) | 4.68 kg/km (16.61 lb/mi) | 2.91 L/100 km (80.7 mpg‑US)[79] |
| Boeing 757-300 | 1998 | 243 | 500 nmi (930 km) | 5.19 kg/km (18.41 lb/mi) | 2.66 L/100 km (88.4 mpg‑US)[79] |
| Bombardier CRJ100 | 1991 | 50 | 577 nmi (1,069 km) | 1.87 kg/km (6.65 lb/mi) | 4.68 L/100 km (50.3 mpg‑US)[63] |
| Bombardier CRJ200 | 1995 | 50 | 580 nmi (1,070 km) | 1.80 kg/km (6.39 lb/mi) | 4.49 L/100 km (52.4 mpg‑US)[63] |
| Bombardier CRJ700 | 1999 | 70 | 574 nmi (1,063 km) | 2.45 kg/km (8.68 lb/mi) | 4.36 L/100 km (54 mpg‑US)[63] |
| Bombardier CRJ900 | 2001 | 88 | 573 nmi (1,061 km) | 2.78 kg/km (9.88 lb/mi) | 3.94 L/100 km (59.7 mpg‑US)[63] |
| Bombardier CRJ1000 | 2009 | 100 | 500 nmi (930 km) | 2.66 kg/km (9.4 lb/mi) | 3.33 L/100 km (71 mpg‑US)[80] |
| Bombardier Dash 8 Q400 | 1998 | 74 | 500 nmi (930 km) | 2.31 kg/km (8.2 lb/mi) | 3.90 L/100 km (60.3 mpg‑US)[81] |
| Bombardier Dash 8 Q400 | 1998 | 74 | 600 nmi (1,100 km) | 1.83 kg/km (6.5 lb/mi) | 3.09 L/100 km (76 mpg‑US)[82] |
| Dornier 328 | 1991 | 31 | 600 nmi (1,100 km) | 1.08 kg/km (3.8 lb/mi) | 4.35 L/100 km (54.1 mpg‑US)[83] |
| Embraer E-Jet E2-175 | 2020 | 88 | 600 nmi (1,100 km) | 2.44 kg/km (8.64 lb/mi) | 3.44 L/100 km (68.3 mpg‑US)[71] |
| Embraer E-Jet E2-190 | 2018 | 106 | 500 nmi (930 km) | 2.48 kg/km (8.8 lb/mi) | 2.93 L/100 km (80 mpg‑US)[84] |
| Embraer E-Jet E2-190 | 2018 | 106 | 600 nmi (1,100 km) | 2.83 kg/km (10.04 lb/mi) | 3.32 L/100 km (70.8 mpg‑US)[71] |
| Embraer E-Jet E2-195 | 2019 | 132 | 500 nmi (930 km) | 2.62 kg/km (9.3 lb/mi) | 2.50 L/100 km (94.1 mpg‑US)[85] |
| Embraer E-Jet E2-195 | 2019 | 132 | 600 nmi (1,100 km) | 3.07 kg/km (10.91 lb/mi) | 2.90 L/100 km (81 mpg‑US)[71] |
| Embraer E-Jet-170 | 2002 | 80 | 606 nmi (1,122 km) | 2.6 kg/km (9.3 lb/mi) | 4.08 L/100 km (57.7 mpg‑US)[86] |
| Embraer E-Jet-175 | 2005 | 88 | 605 nmi (1,120 km) | 2.80 kg/km (9.95 lb/mi) | 3.97 L/100 km (59.3 mpg‑US)[86] |
| Embraer E-Jet-190 | 2004 | 114 | 607 nmi (1,124 km) | 3.24 kg/km (11.48 lb/mi) | 3.54 L/100 km (66.5 mpg‑US)[86] |
| Embraer E-Jet-195 | 2004 | 122 | 607 nmi (1,124 km) | 3.21 kg/km (11.38 lb/mi) | 3.28 L/100 km (71.8 mpg‑US)[86] |
| Embraer ERJ-135ER | 1998 | 37 | 596 nmi (1,104 km) | 1.44 kg/km (5.12 lb/mi) | 4.86 L/100 km (48.4 mpg‑US)[68] |
| Embraer ERJ-145ER | 1996 | 50 | 598 nmi (1,107 km) | 1.55 kg/km (5.49 lb/mi) | 3.86 L/100 km (61 mpg‑US)[68] |
| Pilatus PC-12 | 1991 | 9 | 500 nmi (930 km) | 0.41 kg/km (1.5 lb/mi) | 5.66 L/100 km (41.6 mpg‑US)[87] |
| Saab 340 | 1983 | 31 | 500 nmi (930 km) | 0.95 kg/km (3.4 lb/mi) | 3.83 L/100 km (61.4 mpg‑US)[69] |
| Saab 2000 | 1992 | 50 | 500 nmi (930 km) | 1.54 kg/km (5.5 lb/mi) | 3.85 L/100 km (61.1 mpg‑US)[70] |
| Sukhoi SSJ100 | 2008 | 98 | 500 nmi (930 km) | 2.81 kg/km (10.0 lb/mi) | 3.59 L/100 km (65.5 mpg‑US)[88] |
Short-haul flights
For flights of 1,000 nmi (1,900 km):
| Model | First flight | Seats | Fuel Burn | Fuel efficiency per seat |
|---|---|---|---|---|
| Airbus A220-100 | 2013 | 125 | 2.28 kg/km (8.1 lb/mi) | 2.28 L/100 km (103 mpg‑US)[72] |
| Airbus A220-300 | 2015 | 135 | 2.30 kg/km (8.17 lb/mi) | 2.13 L/100 km (110 mpg‑US)[48] |
| Airbus A220-300 | 2015 | 150 | 2.42 kg/km (8.6 lb/mi) | 2.02 L/100 km (116 mpg‑US)[89] |
| Airbus A220-300 | 2015 | 160 | 2.56 kg/km (9.08 lb/mi) | 2.00 L/100 km (118 mpg‑US)[73] |
| Airbus A319 | 1995 | 124 | 2.93 kg/km (10.4 lb/mi) | 2.95 L/100 km (80 mpg‑US)[90] |
| Airbus A319neo | 2015 | 136 | 2.4 kg/km (8.6 lb/mi) | 2.22 L/100 km (106 mpg‑US)[48] |
| Airbus A320 | 1987 | 150 | 3.13 kg/km (11.1 lb/mi) | 2.61 L/100 km (90 mpg‑US)[90] |
| Airbus A320neo | 2016 | 180 | 2.79 kg/km (9.9 lb/mi) | 1.94 L/100 km (121 mpg‑US)[91] |
| Airbus A321-200 | 1996 | 180 | 3.61 kg/km (12.8 lb/mi) | 2.50 L/100 km (94 mpg‑US)[90] |
| Airbus A321neo | 2017 | 220 | 3.47 kg/km (12.3 lb/mi) | 1.98 L/100 km (119 mpg‑US)[92] |
| Airbus A330-200 | 1997 | 293 | 5.6 kg/km (19.8 lb/mi) | 2.37 L/100 km (99 mpg‑US)[90] |
| Antonov An-148 (1190 nmi) | 2004 | 89 | 2.75 kg/km (9.8 lb/mi) | 3.86 L/100 km (60.9 mpg‑US)[58] |
| Antonov An-158 (1190 nmi) | 2010 | 99 | 2.83 kg/km (10.0 lb/mi) | 3.57 L/100 km (65.9 mpg‑US)[58] |
| Boeing 737-600 | 1998 | 110 | 2.77 kg/km (9.8 lb/mi) | 3.15 L/100 km (75 mpg‑US)[78] |
| Boeing 737-700 | 1997 | 126 | 2.82 kg/km (10.0 lb/mi) | 2.79 L/100 km (84 mpg‑US)[78] |
| Boeing 737-700 | 1997 | 128 | 2.8 kg/km (9.9 lb/mi) | 2.71 L/100 km (87 mpg‑US)[90] |
| Boeing 737 MAX-7 | 2017 | 140 | 2.51 kg/km (8.91 lb/mi) | 1.94 L/100 km (121 mpg‑US)[48] |
| Boeing 737-800 | 1997 | 162 | 3.17 kg/km (11.2 lb/mi) | 2.44 L/100 km (96 mpg‑US)[78] |
| Boeing 737-800 | 1997 | 160 | 3.45 kg/km (12.23 lb/mi) | 2.68 L/100 km (88 mpg‑US)[90] |
| Boeing 737-800W | 1997 | 162 | 3.18 kg/km (11.3 lb/mi) | 2.45 L/100 km (96 mpg‑US)[93] |
| Boeing 737 MAX-8 | 2017 | 162 | 2.71 kg/km (9.6 lb/mi) | 2.04 L/100 km (115 mpg‑US)[93] |
| Boeing 737-900ER | 2006 | 180 | 3.42 kg/km (12.1 lb/mi) | 2.38 L/100 km (99 mpg‑US)[78] |
| Boeing 737-900ERW | 2006 | 180 | 3.42 kg/km (12.1 lb/mi) | 2.37 L/100 km (99 mpg‑US)[93] |
| Boeing 737 MAX-9 | 2017 | 180 | 2.91 kg/km (10.3 lb/mi) | 2.02 L/100 km (116 mpg‑US)[93] |
| Boeing 757-200 | 1982 | 190 | 4.60 kg/km (16.33 lb/mi) | 3.02 L/100 km (78 mpg‑US)[90] |
| Boeing 757-200 | 1982 | 200 | 4.16 kg/km (14.76 lb/mi) | 2.59 L/100 km (90.8 mpg‑US)[79] |
| Boeing 757-300 | 1998 | 243 | 4.68 kg/km (16.62 lb/mi) | 2.40 L/100 km (98 mpg‑US)[79] |
| Boeing 787-8 | 2009 | 248 | 5.50 kg/km (19.5 lb/mi) | 2.77 L/100 km (85 mpg‑US)[94] |
| Boeing 787-9 | 2013 | 296 | 5.67 kg/km (20.1 lb/mi) | 2.39 L/100 km (98 mpg‑US)[95] |
| Boeing 787-10 | 2017 | 336 | 6.09 kg/km (21.6 lb/mi) | 2.27 L/100 km (104 mpg‑US)[96] |
| Quest Kodiak | 2004 | 9 | 0.71 kg/km (2.52 lb/mi) | 6.28 L/100 km (37.5 mpg‑US)[97] |
Medium-haul flights
For flights around 2,000–3,000 nmi (3,700–5,600 km), transcontinental (e.g. Washington Dulles – Seattle-Tacoma is 2,000 nmi) to short transatlantic flights (e.g. New York JFK – London-Heathrow is 3,000 nmi).[98]
| Model | First flight | Seats | Sector | Fuel burn | Fuel per seat |
|---|---|---|---|---|---|
| Airbus A220-300 | 2015 | 150 | 2,000 nmi (3,700 km) | 2.42 kg/km (8.59 lb/mi) | 2.02 L/100 km (116 mpg‑US)[73] |
| Airbus A320 | 1987 | 150 | 2,151 nmi (3,984 km) | 2.91 kg/km (10.3 lb/mi) | 2.43 L/100 km (97 mpg‑US)[99] |
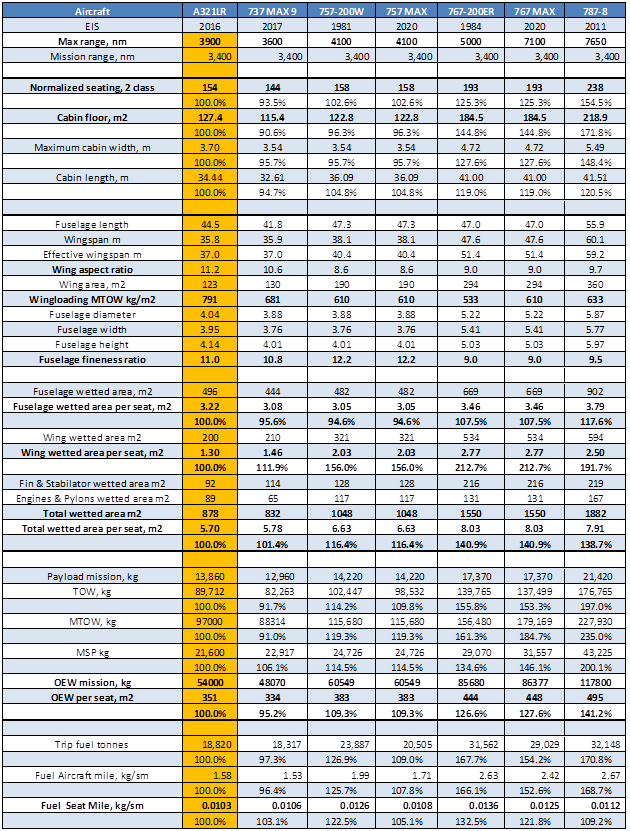
| Airbus A321LR | 2016 | 154 | 3,400 nmi (6,300 km) | 2.99 kg/km (10.6 lb/mi) | 2.43 L/100 km (97 mpg‑US)[100] |
| Airbus A330-200 | 1997 | 241 | 3,000 nmi (5,600 km) | 6 kg/km (21 lb/mi) | 3.11 L/100 km (76 mpg‑US)[101] |
| Airbus A330-300 | 1992 | 262 | 3,000 nmi (5,600 km) | 6.25 kg/km (22.2 lb/mi) | 2.98 L/100 km (79 mpg‑US)[101] |
| Airbus A330-900 | 2016 | 310 | 3,350 nmi (6,200 km) | 6 kg/km (21 lb/mi) | 2.42 L/100 km (97 mpg‑US)[102] |
| Airbus A340-300 | 1992 | 262 | 3,000 nmi (5,600 km) | 6.81 kg/km (24.2 lb/mi) | 3.25 L/100 km (72 mpg‑US)[101] |
| Airbus A380 | 2005 | 544 | 2,000 nmi (3,700 km) | 13.6 kg/km (48.4 lb/mi) | 3.14 L/100 km (75 mpg‑US)[103] |
| Boeing 737 MAX-8 | 2017 | 168 | 3,400 nmi (6,300 km) | 2.86 kg/km (10.1 lb/mi) | 2.13 L/100 km (110 mpg‑US)[104] |
| Boeing 737 MAX-9 | 2017 | 144 | 3,400 nmi (6,300 km) | 2.91 kg/km (10.3 lb/mi) | 2.53 L/100 km (93 mpg‑US)[100] |
| Boeing 747-400 | 1988 | 416 | 2,151 nmi (3,984 km) | 10.77 kg/km (38.2 lb/mi) | 3.24 L/100 km (73 mpg‑US)[99] |
| Boeing 747-8 | 2011 | 467 | 3,000 nmi (5,600 km) | 9.9 kg/km (35 lb/mi) | 2.65 L/100 km (89 mpg‑US)[105] |
| Boeing 757-200W | 1981 | 158 | 3,400 nmi (6,300 km) | 3.79 kg/km (13.4 lb/mi) | 3.00 L/100 km (78 mpg‑US)[100] |
| Boeing 767-200ER | 1984 | 181 | 3,000 nmi (5,600 km) | 4.83 kg/km (17.1 lb/mi) | 3.34 L/100 km (70 mpg‑US)[106] |
| Boeing 767-200ER | 1984 | 193 | 3,400 nmi (6,300 km) | 5.01 kg/km (17.8 lb/mi) | 3.25 L/100 km (72 mpg‑US)[100] |
| Boeing 767-200ER | 1984 | 224 | 3,000 nmi (5,600 km) | 4.93 kg/km (17.5 lb/mi) | 2.75 L/100 km (86 mpg‑US)[106] |
| Boeing 767-300ER | 1988 | 218 | 2,151 nmi (3,984 km) | 5.38 kg/km (19.1 lb/mi) | 3.09 L/100 km (76 mpg‑US)[99] |
| Boeing 767-300ER | 1988 | 218 | 3,000 nmi (5,600 km) | 5.39 kg/km (19.1 lb/mi) | 3.09 L/100 km (76 mpg‑US)[106] |
| Boeing 767-300ER | 1988 | 269 | 3,000 nmi (5,600 km) | 5.51 kg/km (19.5 lb/mi) | 2.56 L/100 km (92 mpg‑US)[106] |
| Boeing 767-400ER | 1999 | 245 | 3,000 nmi (5,600 km) | 5.78 kg/km (20.5 lb/mi) | 2.95 L/100 km (80 mpg‑US)[106] |
| Boeing 767-400ER | 1999 | 304 | 3,000 nmi (5,600 km) | 5.93 kg/km (21.0 lb/mi) | 2.44 L/100 km (96 mpg‑US)[106] |
| Boeing 767-400ER | 1999 | 304 | 3,265 nmi (6,047 km) | 5.92 kg/km (21 lb/mi) | 2.43 L/100 km (96.9 mpg‑US)[77] |
| Boeing 777-200 | 1994 | 305 | 3,000 nmi (5,600 km) | 6.83 kg/km (24.2 lb/mi) | 2.80 L/100 km (84 mpg‑US)[107] |
| Boeing 777-200ER | 1996 | 301 | 3,000 nmi (5,600 km) | 6.96 kg/km (24.7 lb/mi) | 2.89 L/100 km (81 mpg‑US)[101] |
| Boeing 777-300 | 1997 | 368 | 3,000 nmi (5,600 km) | 7.88 kg/km (28.0 lb/mi) | 2.68 L/100 km (88 mpg‑US)[107] |
| Boeing 787-8 | 2009 | 291 | 3,400 nmi (6,300 km) | 5.26 kg/km (18.7 lb/mi) | 2.26 L/100 km (104 mpg‑US)[104] |
| Boeing 787-8 | 2009 | 238 | 3,400 nmi (6,300 km) | 5.11 kg/km (18.1 lb/mi) | 2.68 L/100 km (88 mpg‑US)[100] |
| Boeing 787-9 | 2013 | 304 | 3,350 nmi (6,200 km) | 5.77 kg/km (20.5 lb/mi) | 2.37 L/100 km (99 mpg‑US)[102] |
| Irkut MC-21-300 | 2017 | 163 | 1,750 nmi (3,240 km) | 3.04 kg/km (10.8 lb/mi) | 2.33 L/100 km (101 mpg‑US)[108] |
Long-haul flights
For flights around 5,000 to 7,000 nmi (9,300 to 13,000 km), including transpacific flights (e.g. Hong Kong – San Francisco International is 6,000 nmi).[109]
| Model | First flight | Seats | Sector | Fuel burn | Fuel per seat |
|---|---|---|---|---|---|
| Airbus A330-200 | 1997 | 241 | 6,000 nmi (11,000 km) | 6.4 kg/km (23 lb/mi) | 3.32 L/100 km (71 mpg‑US)[101] |
| Airbus A330-200 | 1997 | 248 | 5,549 nmi (10,277 km) | 6.55 kg/km (23.2 lb/mi) | 3.3 L/100 km (71 mpg‑US)[110] |
| Airbus A330-300 | 1992 | 274 | 5,548 nmi (10,275 km) | 6.81 kg/km (24.2 lb/mi) | 3.11 L/100 km (76 mpg‑US)[110] |
| Airbus A330-800 | 2017 | 248 | 4,650 nmi (8,610 km) | 5.45 kg/km (19.3 lb/mi) | 2.75 L/100 km (86 mpg‑US)[111] |
| Airbus A330-900 | 2017 | 300 | 4,650 nmi (8,610 km) | 5.94 kg/km (21.1 lb/mi) | 2.48 L/100 km (95 mpg‑US)[111] |
| Airbus A340-300 | 1992 | 262 | 6,000 nmi (11,000 km) | 7.32 kg/km (26.0 lb/mi) | 3.49 L/100 km (67.4 mpg‑US)[101] |
| Airbus A350-900 | 2013 | 315 | 4,972 nmi (9,208 km) | 6.03 kg/km (21.4 lb/mi) | 2.39 L/100 km (98 mpg‑US)[102] |
| Airbus A350-900 | 2013 | 318 | 5,534 nmi (10,249 km) | 6.52 kg/km (23.1 lb/mi) | 2.56 L/100 km (92 mpg‑US)[110] |
| Airbus A350-900 | 2013 | 315 | 6,542 nmi (12,116 km) | 7.07 kg/km (25.1 lb/mi) | 2.81 L/100 km (84 mpg‑US)[112] |
| Airbus A350-1000 | 2016 | 327 | 5,531 nmi (10,243 km) | 7.46 kg/km (26.5 lb/mi) | 2.85 L/100 km (83 mpg‑US)[110] |
| Airbus A350-1000 | 2016 | 367 | 5,531 nmi (10,243 km) | 7.58 kg/km (26.9 lb/mi) | 2.58 L/100 km (91 mpg‑US)[110] |
| Airbus A380 | 2005 | 525 | 7,200 nmi (13,300 km) | 13.78 kg/km (48.9 lb/mi) | 3.27 L/100 km (72 mpg‑US)[113] |
| Airbus A380 | 2005 | 544 | 6,000 nmi (11,000 km) | 13.78 kg/km (48.9 lb/mi) | 3.16 L/100 km (74 mpg‑US)[114] |
| Boeing 747-400 | 1988 | 416 | 6,000 nmi (11,000 km) | 11.11 kg/km (39.4 lb/mi) | 3.34 L/100 km (70 mpg‑US)[115] |
| Boeing 747-400 | 1988 | 393 | 5,503 nmi (10,192 km) | 11.82 kg/km (41.9 lb/mi) | 3.76 L/100 km (62.6 mpg‑US)[110] |
| Boeing 747-400 | 1988 | 487 | 5,479 nmi (10,147 km) | 12.31 kg/km (43.7 lb/mi) | 3.16 L/100 km (74 mpg‑US)[110] |
| Boeing 747-8 | 2011 | 467 | 6,000 nmi (11,000 km) | 10.54 kg/km (37.4 lb/mi) | 2.82 L/100 km (83 mpg‑US)[105] |
| Boeing 747-8 | 2011 | 405 | 7,200 nmi (13,300 km) | 10.9 kg/km (39 lb/mi) | 3.35 L/100 km (70 mpg‑US)[113] |
| Boeing 777-200ER | 1996 | 304 | 5,535 nmi (10,251 km) | 7.57 kg/km (26.9 lb/mi) | 3.11 L/100 km (76 mpg‑US)[110] |
| Boeing 777-200ER | 1996 | 301 | 6,000 nmi (11,000 km) | 7.42 kg/km (26.3 lb/mi) | 3.08 L/100 km (76 mpg‑US)[101] |
| Boeing 777-200ER | 1996 | 301 | 6,000 nmi (11,000 km) | 7.44 kg/km (26.4 lb/mi) | 3.09 L/100 km (76 mpg‑US)[107] |
| Boeing 777-200LR | 2005 | 291 | 4,972 nmi (9,208 km) | 7.57 kg/km (26.9 lb/mi) | 3.25 L/100 km (72 mpg‑US)[102] |
| Boeing 777-300ER | 2003 | 382 | 5,507 nmi (10,199 km) | 8.86 kg/km (31.4 lb/mi) | 2.9 L/100 km (81 mpg‑US)[110] |
| Boeing 777-300ER | 2003 | 365 | 6,000 nmi (11,000 km) | 8.49 kg/km (30.1 lb/mi) | 2.91 L/100 km (81 mpg‑US)[107] |
| Boeing 777-300ER | 2003 | 344 | 7,200 nmi (13,300 km) | 8.58 kg/km (30.4 lb/mi) | 3.11 L/100 km (76 mpg‑US)[113] |
| Boeing 777-9X | 2020 | 395 | 7,200 nmi (13,300 km) | 7.69 kg/km (27.3 lb/mi) | 2.42 L/100 km (97 mpg‑US)[113] |
| Boeing 787-8 | 2011 | 243 | 4,650 nmi (8,610 km) | 5.38 kg/km (19.1 lb/mi) | 2.77 L/100 km (85 mpg‑US)[111] |
| Boeing 787-8 GEnx | 2011 | 220 | 5,537 nmi (10,255 km) | 5.3 kg/km (19 lb/mi) | 3.01 L/100 km (78 mpg‑US)[110] |
| Boeing 787-8 Trent | 2011 | 220 | 5,537 nmi (10,255 km) | 5.51 kg/km (19.5 lb/mi) | 3.13 L/100 km (75 mpg‑US)[110] |
| Boeing 787-9 GEnx | 2013 | 294 | 4,650 nmi (8,610 km) | 5.85 kg/km (20.8 lb/mi) | 2.49 L/100 km (94 mpg‑US)[111] |
| Boeing 787-9 | 2013 | 304 | 4,972 nmi (9,208 km) | 5.63 kg/km (20.0 lb/mi) | 2.31 L/100 km (102 mpg‑US)[102] |
| Boeing 787-9 GEnx | 2013 | 266 | 5,534 nmi (10,249 km) | 5.62 kg/km (19.9 lb/mi) | 2.64 L/100 km (89 mpg‑US)[110] |
| Boeing 787-9 | 2013 | 291 | 6,542 nmi (12,116 km) | 7.18 kg/km (25.5 lb/mi) | 3.08 L/100 km (76 mpg‑US)[112] |
| Boeing 787-10 GEnx | 2017 | 337 | 5,529 nmi (10,240 km) | 6.12 kg/km (21.7 lb/mi) | 2.27 L/100 km (104 mpg‑US)[110] |
| Boeing 787-10 Trent | 2017 | 337 | 5,529 nmi (10,240 km) | 6.24 kg/km (22.1 lb/mi) | 2.31 L/100 km (102 mpg‑US)[110] |
For a comparison with ground transportation - much slower and with shorter range than air travel - a Volvo bus 9700 averages 0.41 L/100 km (570 mpg‑US) per seat for 63 seats.[116] In highway travel an average auto has the potential for 1.61 L/100 km (146 mpg‑US)[117] per seat (assuming 4 seats) and for a 5-seat 2014 Toyota Prius, 0.98 L/100 km (240 mpg‑US).[118] While this shows the capabilities of the vehicles, the load factors (percentage of seats occupied) may differ between personal use (commonly just the driver in the car) and societal averages for long-distance auto use, and among those of particular airlines.
General aviation
For private aircraft in general aviation, current FAI Aeroplane Efficiency records are :[119]
- 33.92 km/kg fuel or 3.9 L/100 km in a Aeroprakt-40 two seater for 300– 500 kg MTOW airplanes (C-1a class) (1.95 L/100 km per seat).
- 37.22 km/kg fuel or 3.56 L/100 km in a Monnett Sonerai single-seat racer for 500-1,000 kg MTOW airplanes(C-1b class)
- 9.19 km/kg or 13.6 L/100 km in a four-seat diesel-powered Cessna 182 for 1,000-1,750 kg MTOW airplanes (C-1c class) (3.4 L/100 km per seat).
- 3.08 km/kg or 40.6 L/100 km in a Cirrus SF50 seven-seat jet for 1.75-3 t MTOW airplanes (C-1d class) (5.8 L/100 km per seat).
A four-seat Dyn'Aéro MCR4S powered by a Rotax 914 consumes 8.3 L/100 km at 264 km/h[120] (2.1 L/100 km per seat).
Business aircraft
| Type | Aircraft | US gal | L | lb | kg |
|---|---|---|---|---|---|
| Turboprops | Pilatus PC12[lower-alpha 1] | 66 | 250 | 442 | 200 |
| Cessna Grand Caravan EX[lower-alpha 2] | 58 | 220 | 390 | 177 | |
| King Air 350[lower-alpha 2] | 100 | 379 | 670 | 304 | |
| Light Jets | Cessna Citation M2 | 137–104 | 519–394 | 918–697 | 416–316 |
| Embraer Phenom 100[lower-alpha 3] | 109–77 | 413–291 | 730–516 | 331–234 | |
| Cessna Citation CJ3+[lower-alpha 4] | 124–116 | 469–439 | 830–780 | 376–354 | |
| Embraer Phenom 300[lower-alpha 3] | 166–115 | 628–435 | 1,112–770 | 504–349 | |
| Learjet 70/75[lower-alpha 3] | 239–179 | 905–678 | 1,600–1,200 | 726–544 | |
| Mid-Size Jets | Bombardier Challenger 300[lower-alpha 1] | 266 | 1,007 | 1,782 | 808 |
| Gulfstream G200[lower-alpha 1] | 233 | 882 | 1,561 | 708 | |
| Hawker 900XP[lower-alpha 1] | 257 | 973 | 1,722 | 781 | |
| Cessna Citation X+[lower-alpha 1] | 336 | 1,272 | 2,251 | 1,021 | |
| Dassault Falcon 7X[lower-alpha 1] | 318 | 1,204 | 2,130 | 966 | |
| Long-Range Jets | Gulfstream G550[lower-alpha 3] | 672–447 | 2,544–1,692 | 4,500–3,000 | 2,041–1,361 |
| Bombardier Global 6000 | 512–486 | 1,938–1,840 | 3,430–3,256 | 1,556–1,477 | |
| Airbus ACJ319[lower-alpha 1] | 640 | 2,423 | 4,288 | 1,945 |
Future

.jpg)


NASA and Boeing flight-tested a 500 lb (230 kg) blended wing body (BWB) X-48B demonstrator from August 2012 to April 2013. This design provides greater fuel efficiency, since the whole craft produces lift, not just the wings.[122] The BWB concept offers advantages in structural, aerodynamic and operating efficiencies over today's more-conventional fuselage-and-wing designs. These features translate into greater range, fuel economy, reliability and life-cycle savings, as well as lower manufacturing costs.[123][124] NASA has created a cruise efficient STOL (CESTOL) concept.
Fraunhofer Institute for Manufacturing Engineering and Applied Materials Research (IFAM) have researched a sharkskin-imitating paint that would reduce drag through a riblet effect.[125] Aviation is a major potential application for new technologies such as aluminium metal foam and nanotechnology.
The International Air Transport Association (IATA) technology roadmap envisions improvements in aircraft configuration and aerodynamics. It projects the following reductions in engine fuel consumption, compared to baseline aircraft in service in 2015:[126]
- 10-15% from higher pressure and bypass ratios, lighter materials, implemented in 2010–2019
- 20-25% from high pressure core + ultra-high by-pass ratio geared turbofan, from ~2020-25
- 30% from open rotors (propfans), from ~2030
- 40-80% from hybrid electric propulsion (depending on battery use), from ~2030-40
- up to 100% due to Fully electric propulsion (primary energy from renewable source), from ~2035-40.
Moreover, it projects the following gains for aircraft design technologies:[126]
- 6 to 12% from airframe retrofits (winglets, riblets, lightweight cabin furnishing) currently available
- 4 to 10% from materials and Structure (composite structure, adjustable landing gear, fly-by-wire) also currently available
- 1 to 4% from electric taxiing from 2020+
- 5 to 15% from advanced aerodynamics (hybrid/natural laminar flow, variable camber, spiroid wingtip) from 2020–25
- 30% from strut-braced wings (with advanced turbofan engines, ~2030-35)
- 35% from a double bubble fuselage like the Aurora D8 (with advanced turbofan engines, ~2035)
- 30-35% from a box/joined closed wing (with advanced turbofan engines, ~2035-40)
- 27 to 50% from a blended wing body design (with hybrid propulsion, ~2040)
- Up to 100% with fully electric aircraft (short range, ~2035-45)
Today's tube-and-wing configuration could remain in use until the 2030s due to drag reductions from active flutter suppression for slender flexible-wings and natural and hybrid laminar flow.[127] Large, ultra high bypass engines will need upswept gull wings or overwing nacelles as Pratt & Whitney continue to develop their geared turbofan to save a projected 10–15% of fuel costs by the mid-2020s.[127] NASA indicates this configuration could gain up to 45% with advanced aerodynamics, structures and geared turbofans, but longer term suggests savings of up to 50% by 2025 and 60% by 2030 with new ultra-efficient configurations and propulsion architectures: hybrid wing body, truss-braced wing, lifting body designs, embedded engines, and boundary-layer ingestion.[127] By 2030 hybrid-electric architectures may be ready for 100 seaters and distributed propulsion with tighter integration of airframe may enable further efficiency and emissions improvements.[127]
Research projects such as Boeing's ecoDemonstrator program have sought to identify ways of improving the fuel economy of commercial aircraft operations. The U.S. government has encouraged such research through grant programs, including the FAA's Continuous Lower Energy, Emissions and Noise (CLEEN) program, and NASA's Environmentally Responsible Aviation (ERA) Project.[citation needed]
Multiple concepts are projected to reduce fuel consumption:[128]
- the Airbus/Rolls-Royce E-Thrust is a hybrid electric with a gas turbine engine and electric ducted fans with energy storage allowing peak power for takeoff and climb while for the descent the engine is shut down and the fans recover energy to recharge the batteries;[128]
- Empirical Systems Aerospace (ESAero) is developing the 150-seat ECO-150 concept for turboelectric distributed propulsion with two turboshaft engines mounted on the wing and driving generators powering ducted fans embedded in the inboard wing sections, effectively increasing the bypass ratio and propulsive efficiency for 20–30% fuel savings over the Boeing 737 NG, while providing some powered lift;[128]
- NASA's single-aisle turbo-electric aircraft with an aft boundary layer propulsor (STARC-ABL) is a conventional tube-and-wing 737-sized airliner with an aft-mounted electric fan ingesting the fuselage boundary layer hybrid-electric propulsion, with 5.4 MW of power distributed to three electric motors: the design will be evaluated by Aurora Flight Sciences;[129]
- The Boeing blended wing body (BWB) with a wide fuselage mated to high-aspect-ratio wings is more aerodynamically efficient because the entire aircraft contributes to the lift and it has less surface area, producing less drag and offering weight savings due to lower wing loading, while noise is shielded by locating the engines on the aft upper surface;[128]
- Developed with the U.S. Air Force Research Laboratory and refined with NASA, the Lockheed Martin Hybrid Wing Body (HWB) combines a blended forward fuselage and wing with a conventional aft fuselage and T-tail for compatibility with existing infrastructure and airdrop; the engines in overwing nacelles on struts over the trailing edge enable higher-bypass-ratio engines with 5% less drag, provide acoustic shielding and increases lift without a thrust or drag penalty at low speed;[128]
- Airbus-backed German Bauhaus-Luftfahrt designed the Propulsive Fuselage concept, reducing drag with a fan in the tail ingesting air flowing over the fuselage via an annular (ring-shaped) inlet and re-energizes the wake, driven with a gearbox or as a turbo-electric configuration;[128]
- Conceived by the Massachusetts Institute of Technology for NASA, Aurora Flight Sciences developed the "double-bubble" D8, a 180-seat aircraft with a wide lifting fuselage, twin-aisle cabin to replace A320 and B737 narrowbodies, and boundary-layer ingestion with engines in the tail driving distortion-tolerant fans for a 49% fuel-burn reduction over the B737NG;[128]
- The Boeing truss-braced wing (TBW) concept was developed for the NASA-funded Subsonic Ultra Green Aircraft Research program with an aspect ratio of 19.5 compared to 11 for the Boeing 787: the strut relieves some bending moment and a braced wing can be lighter than a cantilevered wing or longer for the same weight, having better lift-to-drag ratio by lowering the induced drag and thinner, facilitating natural laminar flow and reducing wave drag at transonic speeds;[128]
- Dzyne Technologies reduces the thickness of the blended wing body for a 110–130-seat super-regional, a configuration usually too thick for a narrowbody replacement and better suited for large aircraft, by placing the landing gear outward and storing baggage in the wing roots, enabling 20% fuel savings;[128]
- the French research agency ONERA designed two concepts for a 180-seat airliner Versatile Aircraft (NOVA) including turbofans with higher bypass ratios and fan diameter: a gull wing with increased dihedral inboard to accommodate larger geared turbofans under without lengthening the gear and the other with engines embedded in the tail to ingest the low-energy fuselage boundary layer flow and re-energize the wake to reduce drag;[130]
- with Cranfield University, Rolls-Royce developed the Distributed Open Rotor (DORA) with high-aspect-ratio wing and V-tail to minimize drag, and turbogenerators on the wing driving electric propellers along the inboard leading edge with open rotor high-propulsive efficiency and increasing the effective bypass ratio.[128]
Climate change
<templatestyles src="Module:Hatnote/styles.css"></templatestyles>
The growth of air travel outpaces its fuel-economy improvements and corresponding CO2 emissions, compromising climate sustainability. Although low-cost carriers' higher seat-density increases fuel economy and lowers greenhouse gas emissions per-passenger-kilometer, the lower airfares cause a rebound effect of more flights and larger overall emissions. The tourism industry could shift emphasis to emissions eco-efficiency in CO2 per unit of revenue or profit instead of fuel economy, favoring shorter trips and ground transportation over flying long journeys to reduce greenhouse gas emissions.[131]
See also
References
External links
 Fuel and air transport.


  European Commission.
  Retrieved  from link
 Aircraft Technology Roadmap to 2050.

  (2019)
  IATA.
  Retrieved  from link
 Review of Propulsion Technologies for N+3 Subsonic Vehicle Concepts.

  (October 2011)
  NASA.
  Retrieved  from link
 Air Transport and Energy Efficiency.

  (February 2012)
  World Bank.
  Retrieved  from link
- Lua error: bad argument #1 to "get" (not a valid title).
- Lua error: bad argument #1 to "get" (not a valid title).
 Transatlantic airline fuel efficiency ranking, 2014.

  (November 2015)
  International Council on Clean Transportation.
  Retrieved  from link
- Lua error: bad argument #1 to "get" (not a valid title).
- ↑ Lua error: bad argument #1 to "get" (not a valid title).
- ↑ 2.0 2.1 CO2 emissions from commercial aviation, 2018. (September 2019) International Council on Clean Transportation. Retrieved from link
- ↑ EXACT Results - How Slow Should We Go - DLR Presentation for Safe Landing. Georgi Atanasov. Retrieved 2025-01-01 from link
- ↑ Short Medium Range Turboprop-Powered Aircraft as an Enabler for Low Climate Impact. G. Atanasov, D. Silberhorn, P. Wassink, Dr. J. Hartmann, E. Prenzel, S. Wöhler, Dr. N. Dzikus, B. Fröhler, Dr. T. Zill, Dr. B. Nagel; DLR - Deutsches Zentrum für Luft- und Raumfahrt. Retrieved 2025-01-01 from link
- ↑ Airport 2030 - AP 4.1; Configuration for Scenario 2015 (Possible A320 Successor). Andreas Johanning, Dieter Scholz; Hamburg University of Applied Sciences. Retrieved 2025-01-01 from link
- ↑ Performance > Speed. Aerion. Retrieved 6 April 2017 from link
- ↑ Lua error: bad argument #1 to "get" (not a valid title).
- ↑ The impact of winglets on fuel consumption and aircraft emissions. Retrieved 2023-08-24 from Cirium
- ↑ Lua error: bad argument #1 to "get" (not a valid title).
- ↑ Composites flying high (Part 1). (8 April 2014) Materials Today. Retrieved 23 May 2015 from link
- ↑ Lua error: bad argument #1 to "get" (not a valid title).
- ↑ Park Y., O'Kelly M.E. (2014). Fuel burn rates of commercial passenger aircraft: variations by seat configuration and stage distance. Jrnl. Transp. Geog., 41:pp.137-147.
- ↑ Why the Longest Nonstop Flights Are Ending, Bloomberg Bus., 31 October 2013.
- ↑ Lua error: bad argument #1 to "get" (not a valid title).
- ↑ Lua error: bad argument #1 to "get" (not a valid title).
- ↑ A new era of 'ultra-long-haul' aviation. (6 November 2015) Retrieved 22 December 2016 from link
- ↑ Lua error: bad argument #1 to "get" (not a valid title).
- ↑ Unified Propulsion Lecture 1. Zoltan Spakovszky. MIT. Retrieved from link
- ↑ Lua error: bad argument #1 to "get" (not a valid title).
- ↑ 20.0 20.1 20.2 Back to the Future: Return of the Turboprop?. (3 June 2014) The International Council on Clean Transport. Retrieved from link
- ↑ Lua error: bad argument #1 to "get" (not a valid title).
- ↑ <templatestyles src="Citation/styles.css"/>US application 2009020643, Airbus & Christophe Cros, "Aircraft having reduced environmental impact", published Lua error: bad argument #1 to "get" (not a valid title).
- ↑ Advanced Turboprop Project. (January 1988) Retrieved 2022-01-27 from ntrs.nasa.gov
- ↑ Lua error: bad argument #1 to "get" (not a valid title).
- ↑ U.S. domestic airline fuel-efficiency ranking 2017-2018. (12 Sep 2019) ICCT. Retrieved from link
- ↑ Calculating the carbon footprint from different classes of air travel. (May 2013) World Bank. Retrieved from link
- ↑ Lua error: bad argument #1 to "get" (not a valid title).
- ↑ Lua error: bad argument #1 to "get" (not a valid title).
- ↑ Annual Report. (July 2016) Ryanair. Retrieved from link
- ↑ 30.0 30.1 Transpacific airline fuel efficiency ranking, 2016. (Jan 2018) ICCT. Retrieved from link
- ↑ Sustainable Development Report 2016. (April 2017) Cathay Pacific. Retrieved from link
- ↑ Lua error: bad argument #1 to "get" (not a valid title).
- ↑ Transatlantic airline fuel efficiency ranking, 2017. (12 September 2018) ICCT. Retrieved from link
- ↑ Lua error: bad argument #1 to "get" (not a valid title).
- ↑ Lua error: bad argument #1 to "get" (not a valid title).
- ↑ Lua error: bad argument #1 to "get" (not a valid title).
- ↑ Lua error: bad argument #1 to "get" (not a valid title).
- ↑ Lua error: bad argument #1 to "get" (not a valid title).
- ↑ Lua error: bad argument #1 to "get" (not a valid title).
- ↑ 40.0 40.1 40.2 Fuel Burn vs. Maintenance Costs. (October 2012) Airbus. Retrieved from link
- ↑ Lua error: bad argument #1 to "get" (not a valid title).
- ↑ 42.0 42.1 42.2 42.3 42.4 Lua error: bad argument #1 to "get" (not a valid title).
- ↑ Lua error: bad argument #1 to "get" (not a valid title).
- ↑ Efficiency Trends for New Commercial Jet Aircraft, 1960 to 2008. (November 2009) The International Council on Clean Transportation. Retrieved from link
- ↑ 45.0 45.1 Fuel efficiency of commercial aircraft. (November 2005) Netherlands National Aerospace Laboratory. Retrieved from link
- ↑ Approaches to Representing Aircraft Fuel Efficiency. Performance for the Purpose of a Commercial Aircraft. (May 2011) MIT International Center for Air Transportation. Retrieved from link
- ↑ Lua error: bad argument #1 to "get" (not a valid title).
- ↑ 48.0 48.1 48.2 48.3 CS300 first flight Wednesday, direct challenge to 737-7 and A319neo. (25 February 2015) Leeham News. Retrieved from link
- ↑ Lua error: bad argument #1 to "get" (not a valid title).
- ↑ Lua error: bad argument #1 to "get" (not a valid title).
- ↑ Lua error: bad argument #1 to "get" (not a valid title).
- ↑ The A380: The future of flying. Airbus. Retrieved 22 March 2008 from link
- ↑ Lua error: bad argument #1 to "get" (not a valid title).
- ↑ Lua error: bad argument #1 to "get" (not a valid title).
- ↑ Lua error: bad argument #1 to "get" (not a valid title).
- ↑ Lua error: bad argument #1 to "get" (not a valid title).
- ↑ Lua error: bad argument #1 to "get" (not a valid title).
- ↑ 58.0 58.1 58.2 58.3 58.4 58.5 AN-148/AN-158 family overview. (2017) Antonov. Retrieved from link
- ↑ 59.0 59.1 Fuel saving. (January 2011) ATR. Retrieved from link
- ↑ Proud to fly a Turboprop: Q400 vs ATR72. (10 November 2011) The Flying Engineer. Retrieved from link
- ↑ ATR 72-600 The first choice for operators. Retrieved from link
- ↑ Beechcraft 1900D: Fuel, Emissions & Cost Savings Operational Analysis. (21 February 2012) Specific Range Solutions Ltd.. Retrieved from link
- ↑ 63.0 63.1 63.2 63.3 63.4 63.5 63.6 63.7 Lua error: bad argument #1 to "get" (not a valid title).
- ↑ Proud to fly a Turboprop: Q400 vs ATR72. (10 November 2011) The Flying Engineer. Retrieved from link
- ↑ Dornier 228 Advanced Commuter Brochure. RUAG. Retrieved from link
- ↑ Lua error: bad argument #1 to "get" (not a valid title).
- ↑ 120 Brasilia Sales Brochure. Embraer. Retrieved from link
- ↑ 68.0 68.1 68.2 68.3 Owner's & Operator's Guide: ERJ-135/-140/-145. (Dec 2008) Retrieved from link
- ↑ 69.0 69.1 Saab 340A data sheet. (2009) Saab Aircraft Leasing. Retrieved 20 December 2016 from link
- ↑ 70.0 70.1 Saab 2000 data sheet. (2009) Saab Aircraft Leasing. Retrieved 20 December 2016 from link
- ↑ 71.0 71.1 71.2 71.3 71.4 71.5 71.6 Embraer continues and refines its strategy at the low-end of 100-149 seat sector. (13 January 2014) Leeham News. Retrieved from link
- ↑ 72.0 72.1 CS100 environmental product declaration. (27 September 2016) Bombardier. Retrieved from link
- ↑ 73.0 73.1 73.2 CS300 environmental product declaration. (27 September 2017) Bombardier. Retrieved from link
- ↑ 74.0 74.1 74.2 74.3 74.4 74.5 ANALYSIS: A320neo vs. 737 MAX: Airbus is Leading (Slightly) – Part II. (5 February 2016) Airways News. Retrieved from link
- ↑ Air Investor 2021 p.43. (January 2021) Air Finance Journal. Retrieved from link
- ↑ Air Investor 2021 p.44. (January 2021) Air Finance Journal. Retrieved from link
- ↑ 77.0 77.1 A Prius With Wings vs. a Guzzler in the Clouds. (12 August 2010) Wall Street Journal. Retrieved from link
- ↑ 78.0 78.1 78.2 78.3 78.4 78.5 78.6 78.7 737 performance summary. (2007) Boeing. Retrieved from link
- ↑ 79.0 79.1 79.2 79.3 757 performance summary. (2007) Boeing. Retrieved from link
- ↑ Bombardier CRJ1000 Fuel Consumption. (20 August 2013) Sun Airlines. Retrieved from link
- ↑ Q400 Fuel efficiency manual. (2014) Bombardier. Retrieved from link
- ↑ Q400 Fuel efficiency manual. (2014) Bombardier. Retrieved from link
- ↑ Lua error: bad argument #1 to "get" (not a valid title).
- ↑ Air Investor 2021, p.51. (January 2021) Air Finance Journal. Retrieved from link
- ↑ Air Investor 2021, p.52. (January 2021) Air Finance Journal. Retrieved from link
- ↑ 86.0 86.1 86.2 86.3 Owner's & Operator's Guide: E-Jets family. (Jun 2009) Retrieved from link
- ↑ PC-12 NG Just The Facts. (20 October 2015) Pilatus. Retrieved 27 July 2016 from link
- ↑ Sukhoi SSJ100, Embraer ERJ190, Airbus A319 Operational and Economic Comparison. (March 2013) Sukhoi. Retrieved from link
- ↑ Air Investor 2021 p.36. (January 2021) Air Finance Journal. Retrieved from link
- ↑ 90.0 90.1 90.2 90.3 90.4 90.5 90.6 Analysing the options for 757 replacement. (August 2005) Aircraft Commerce. Retrieved 16 July 2014 from link
- ↑ Air Investor 2021. (January 2021) Air Finance Journal. Retrieved from link
- ↑ Air Investor 2021 p.39. (January 2021) Air Finance Journal. Retrieved from link
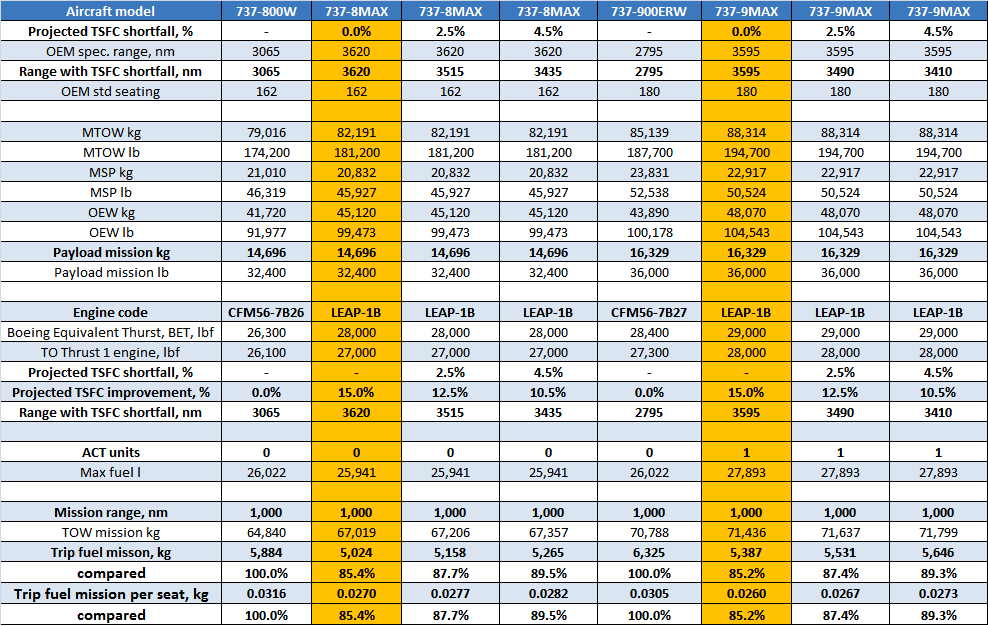
- ↑ 93.0 93.1 93.2 93.3 Boeing 737 MAX: performance with reported engine SFC shortfall. (15 April 2015) Leeham News. Retrieved from link
- ↑ Air Investor 2021, p.48. (January 2021) Air Finance Journal. Retrieved from link
- ↑ Air Investor 2021, p.48. (January 2021) Air Finance Journal. Retrieved from link
- ↑ Air Investor 2021, p.48. (January 2021) Air Finance Journal. Retrieved from link
- ↑ Kodiak Brochure. (April 2014) Quest Aircraft. Retrieved 20 February 2017 from link
- ↑ Distance from JFK to LHR. great circle mapper. Retrieved from link
- ↑ 99.0 99.1 99.2 Lua error: bad argument #1 to "get" (not a valid title).
- ↑ 100.0 100.1 100.2 100.3 100.4 Redefining the 757 replacement: Requirement for the 225/5000 Sector. (25 February 2015) Leeham News. Retrieved from link
- ↑ 101.0 101.1 101.2 101.3 101.4 101.5 101.6 Boeing: 777 way much better than A330. (8 December 2010) Aspire aviation. Retrieved from link
- ↑ 102.0 102.1 102.2 102.3 102.4 UPDATED ANALYSIS: Delta Order for A350; A330neo Hinged on Pricing, Availability. (25 November 2014) Airways News. Retrieved 28 November 2014 from link
- ↑ Air Investor 2021, p.43. (January 2021) Air Finance Journal. Retrieved from link
- ↑ 104.0 104.1 Lua error: bad argument #1 to "get" (not a valid title).
- ↑ 105.0 105.1 747-8 performance summary. (2010) Boeing. Retrieved from link
- ↑ 106.0 106.1 106.2 106.3 106.4 106.5 767 performance summary. (2006) Boeing. Retrieved from link
- ↑ 107.0 107.1 107.2 107.3 777 performance summary. (2009) Boeing. Retrieved from link
- ↑ Lua error: bad argument #1 to "get" (not a valid title).
- ↑ Distance from HKG to SFO. great circle mapper. Retrieved from link
- ↑ 110.00 110.01 110.02 110.03 110.04 110.05 110.06 110.07 110.08 110.09 110.10 110.11 110.12 110.13 Lufthansa Systems' Lido/Flight via Lua error: bad argument #1 to "get" (not a valid title).
- ↑ 111.0 111.1 111.2 111.3 ANALYSIS: The Boeing 787-8 and Airbus A330-800neo are Far From Dead. (17 March 2016) Airways News. Retrieved from link
- ↑ 112.0 112.1 Airbus A350: is the Xtra making the difference ?. (8 June 2015) Aspire Aviation. Retrieved from link
- ↑ 113.0 113.1 113.2 113.3 Updating the A380: the prospect of a neo version and what's involved. (3 February 2014) leeham news. Retrieved from link
- ↑ Lua error: bad argument #1 to "get" (not a valid title).
- ↑ 747 performance summary. (2010) Boeing. Retrieved from link
- ↑ Coach fuel consumption. (12 September 2013) volvo buses. Retrieved from link
- ↑ DEFRA (2008). 2008 Guidelines to Defra's GHG Conversion Factors: Methodology Paper for Transport Emission Factors Archived 5 January 2012 at the Wayback Machine
- ↑ 2014 Toyota Prius fuel economy. United States Environmental Protection Agency. Retrieved from link
- ↑ Records > Aeroplane efficiency > Current. Fédération Aéronautique Internationale. Retrieved from link
- ↑ MCR4S Brochure. (Aug 2021) SE Aviation Aircraft. Retrieved from link
- ↑ Lua error: bad argument #1 to "get" (not a valid title).
- ↑ Fuel Efficient Plane Prototype Hits Skies. (8 October 2007) Ecogeek. Retrieved 6 July 2014 from link
- ↑ Lua error: bad argument #1 to "get" (not a valid title).
- ↑ AEDC testing brings unique blended wing aircraft closer to flight.. (3 July 2007) Arnold Air Force Base. Retrieved 10 April 2012 from link
- ↑ A sharkskin coating for ships, planes and blades. Melissa Mahony. (25 May 2010) SmartPlanet. Retrieved 29 September 2012 from link
- ↑ 126.0 126.1 Technology Roadmap for Environmental Improvement - Fact Sheet. (December 2019) IATA. Retrieved from link
- ↑ 127.0 127.1 127.2 127.3 Lua error: bad argument #1 to "get" (not a valid title).
- ↑ 128.00 128.01 128.02 128.03 128.04 128.05 128.06 128.07 128.08 128.09 Lua error: bad argument #1 to "get" (not a valid title).
- ↑ Lua error: bad argument #1 to "get" (not a valid title).
- ↑ Lua error: bad argument #1 to "get" (not a valid title).
- ↑ Lua error: bad argument #1 to "get" (not a valid title).
Cite error: <ref> tags exist for a group named "lower-alpha", but no corresponding <references group="lower-alpha"/> tag was found
- Pages with math render errors
- Pages with script errors
- Articles with short description
- Use dmy dates from September 2019
- Articles with invalid date parameter in template
- Use American English from November 2020
- All Wikipedia articles written in American English
- All articles with unsourced statements
- Articles with unsourced statements from November 2020
- Articles with unsourced statements from June 2016
- Articles with hatnote templates targeting a nonexistent page
- Aircraft operations
- Energy economics
- Aviation and the environment
- Webarchive template wayback links
- Pages with reference errors
